What is Line Graph?
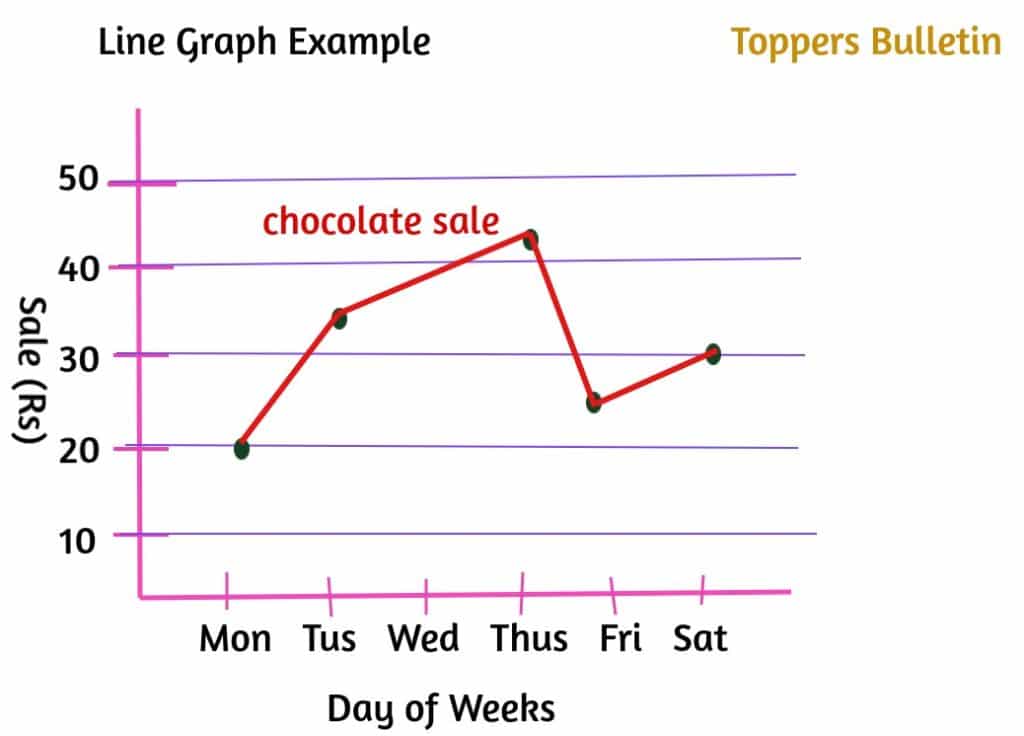
A line graph is a type of diagram applied to show information that varies over time. We plot line charts using various points joined by straight lines. The line graph includes 2 axes identified as the ‘x’ axis and ‘y’ axis.
A line graph is a type of diagram applied to show information that varies over time. We plot line charts using various points joined by straight lines. The line graph includes 2 axes identified as the ‘x’ axis and ‘y’ axis.